
Financial Insights & Expert Advice
Explore articles, tips, and strategies to help you make confident money decisions at every stage of life.

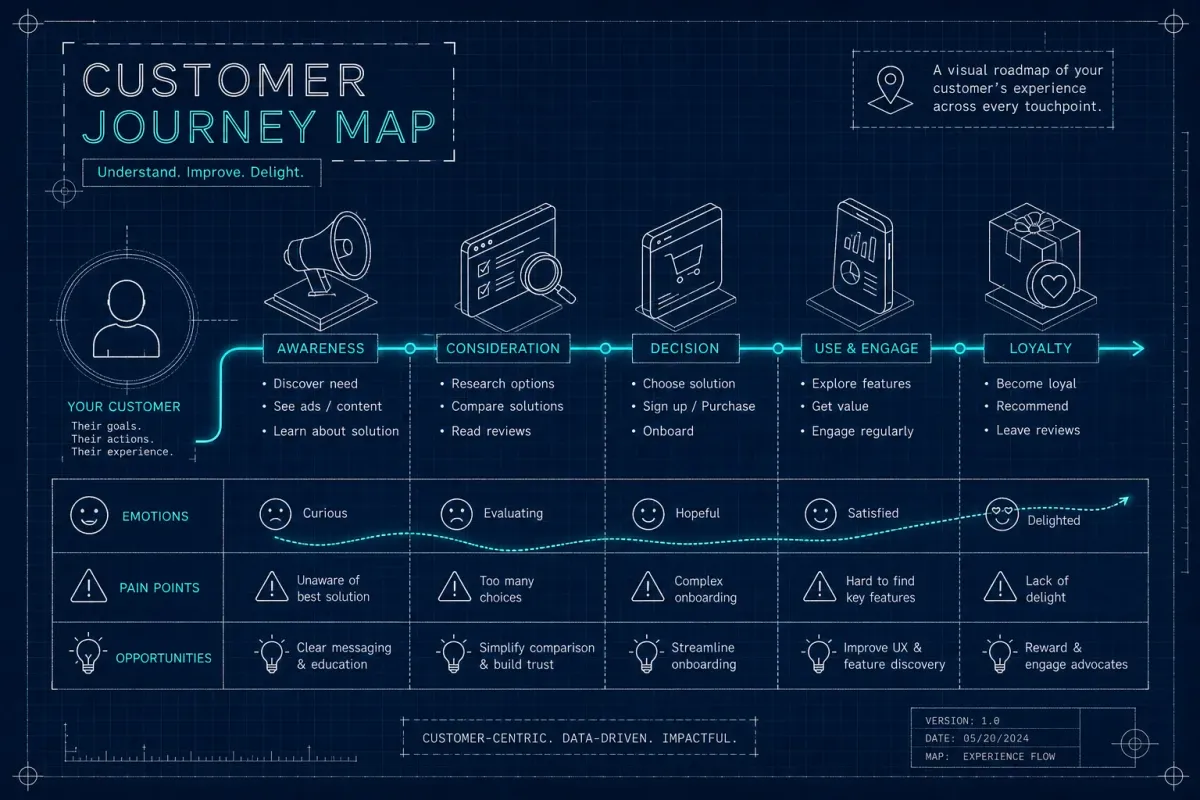
Complete Guide to Customer Journey Mapping
What Is a Customer Journey Map? A Complete Guide
What is a customer journey map, and why do so many marketing teams operate without one? Budgets get approved. Campaigns launch. Reports get filed. And still, no one can explain with confidence why customers convert in one channel and quietly disappear in another. The instinct is to blame the creative, adjust the targeting, or switch agencies. But the real problem is usually more foundational: there is no shared picture of what customers actually experience from first contact to committed purchase.
A customer journey map solves that. It is the diagnostic tool that reveals where the experience works, where it breaks down, and what is actually driving customer decisions, as opposed to what internal teams assume is driving them. It is also the first exercise in any new fractional CMO engagement by Ryan Paxton, a Senior Marketing Executive, before a single dollar of spend gets reallocated and before any campaign brief gets written. The map has to come first, because without it, strategy is just an educated guess.
This guide covers everything from the working definition to a step-by-step build process, the tools worth using, and the metrics that tell you whether the work is paying off.
The definition that actually holds up in practice
A customer journey map is a visual representation of the complete experience a customer has with a brand, from the first moment of awareness through purchase and into post-purchase moments like onboarding, support, and loyalty. It documents customer actions, thoughts, emotional states, touchpoints, and pain points across time. Critically, it reflects what customers actually do, not what the brand assumes they do.
That distinction matters more than it sounds. Most organizations already have an internal version of "the funnel" sketched somewhere, usually built from analytics dashboards, sales pipeline stages, or marketing team intuition. The problem is that those internal models describe how the brand wishes the journey worked. A real customer journey map describes how it works in practice, which is often messier, longer, and shaped by friction points that never show up in a click report.
How it differs from a service blueprint and a user journey map
These three tools get confused regularly, and using the wrong one for the wrong problem wastes time and produces answers to questions no one actually asked. A customer journey map shows what the customer experiences. A service blueprint shows the internal operations and backstage processes that support that experience. A user journey map, sometimes called a user flow, shows how someone navigates a specific task inside a product or interface.
If you are trying to understand why customers feel confused during onboarding, a journey map is the right tool. If you are trying to fix the internal handoff between sales and customer success that causes that confusion, you need a service blueprint. If you are trying to optimize the step-by-step path through an app feature, you need a user journey map. Each one serves a different diagnostic purpose.
Core Stages Every Map Covers
From awareness to consideration
Awareness is the moment a customer first encounters the brand, through organic search, paid social, word of mouth, a referral, or any other channel where the brand shows up before someone is actively shopping. Consideration is the evaluation phase: the customer is researching options, comparing alternatives, reading reviews, and deciding whether this brand earns a closer look. These two stages are often the least understood by internal teams because most analytics platforms track clicks and sessions, not the intent and emotional state behind them.
What gets missed here is the emotional dimension. Customers in the awareness stage are not yet convinced they have a problem worth solving. Customers in the consideration stage are building trust, or losing it, based on signals that rarely show up in a dashboard. A well-built journey map captures those signals because it draws from customer interviews and qualitative research, not just conversion data.
Purchase, onboarding, and retention
Purchase is the conversion moment, and it is rarely a single click. For most brands, it is a sequence of micro-decisions: comparing final options, checking a return policy, looking for a discount code, or sending a quick message to a friend. A buyer journey map that treats "purchase" as a single box misses the texture of that decision-making sequence. That sequence is where friction most often accumulates.
Onboarding is a stage many brands underinvest in, and it is one of the highest-leverage stages in the entire map. The experience a customer has in the first hours or days after conversion directly shapes whether they stay or churn, whether they expand their relationship with the brand or quietly disengage. Retention and advocacy come after that, and they determine lifetime value, referral behavior, and whether the economics of acquisition ever actually pay off. A complete customer experience map does not stop at the sale. That is where a lot of the value is created or destroyed.
Why mid-market brands can't afford to skip this step
The cost of disconnected marketing spend
Mid-market brands face a specific problem: they have enough budget to run multi-channel campaigns but not enough visibility to know which touchpoints are doing real work. Without a buyer journey map grounding the strategy, marketing decisions get made on gut feel or last-click attribution data. Both approaches systematically misrepresent where customers actually make decisions, because last-click attribution gives 100% of the credit to the final interaction before conversion and ignores every awareness and consideration touchpoint that shaped the decision.
The result is budget flowing toward channels that look productive on a dashboard but are not driving revenue. Awareness tactics get cut because they do not show direct conversions. Bottom-funnel tactics get over-funded because bottom-funnel tactics receive all the attribution credit. The journey map corrects that by showing how touchpoints actually work together across the full path to conversion.
How a journey map connects strategy to real customer behavior
In a full-funnel engagement, building or auditing the customer journey map is the diagnostic foundation, not a deliverable that arrives after the strategy is set. It is the document that aligns the marketing team, the sales team, and senior leadership around a shared picture of what customers actually do. Without that shared picture, every cross-functional conversation about campaign strategy or budget allocation starts from a different set of assumptions.
CX mapping is also the tool that surfaces the gap between brand intent and customer reality. Brands often believe their onboarding experience is smooth and their messaging is clear. Customers often experience something completely different. The journey map makes that gap visible before any campaign gets built around assumptions the evidence does not support.
How to build a customer journey map without overcomplicating it
Start with research, not assumptions
The most common and damaging mistake in a first journey mapping exercise is starting with an internal workshop before collecting any customer evidence. When a room full of smart people builds a journey map from memory and intuition, they produce a map of how the brand wishes the journey worked. It will be detailed, well-organized, and wrong in the ways that matter most.
Start by defining a clear objective and a specific customer segment. Then collect evidence before drawing anything. Useful inputs include customer interviews, support call themes, CRM records, session recordings, and stage-level conversion analytics. The research phase is not optional; it is the thing that makes the map accurate instead of aspirational.
Map touchpoints, emotions, and pain points by stage
The core structure of a journey map places stages across the top and rows below for customer actions, emotional states, touchpoints and channels, and pain points or friction moments. For each stage, the map captures what the customer is trying to accomplish, what they think and feel, which channels they are interacting with, and where they encounter obstacles or uncertainty.
The most valuable insight usually isn't the stages themselves; it's the emotional valleys between them. These are the moments where confidence drops, where questions go unanswered, and where customers quietly disengage without ever telling the brand why. Those valleys are where the highest-leverage improvements live.
Turn the map into a prioritized action plan
A customer journey map that sits in a shared drive and never gets acted on is a completed task, not a strategy tool. It becomes useful when findings are prioritized by impact and effort, ownership is assigned to specific teams, and review cadences are built in so the map updates as evidence changes.
Connect the journey map directly to campaign planning, CRM architecture, and retention programs. That is how it becomes a living operating document rather than a workshop output. Journey mapping exercises that stay disconnected from execution decisions produce beautifully formatted diagrams and zero business impact.
Tools and templates that make this process manageable
Purpose-built platforms vs. collaboration tools
Purpose-built platforms like UXPressia and Smaply offer structured templates, persona layers, and stakeholder-ready outputs. UXPressia starts at around $160 per month; Smaply's repository-level plan is priced at approximately €390 per month (pricing is in euros and should be confirmed on Smaply's pricing page for your region). These tools are worth the cost for teams that need polished outputs, multi-persona layering, or healthcare and B2B-specific templates.
Collaboration tools like Miro and Mural are better for cross-functional workshops and are easier to get an entire team into quickly, at $8 to $10 per user per month for entry-level plans. For teams that need a free starting point, draw.io handles basic mapping without a paywall and works well for early-stage exercises where the goal is clarity, not presentation quality.
Templates worth bookmarking by industry
UXPressia is a leading source of B2B SaaS and healthcare buyer journey templates, particularly for multi-persona, sales-to-onboarding-to-retention flows. Custellence offers well-structured templates for medical and patient-facing journeys. Smaply and HubSpot are practical starting points for retail and e-commerce use cases. Canva and Miro are the better options when the output needs to be presentation-ready for leadership or board-level reviews.
For a practical journey map example: a B2B SaaS company mapping its buyer journey might layer three personas (IT lead, financial decision-maker, end user) across six stages, with separate rows for actions, emotions, and friction points at each stage. That structure looks nothing like a retail e-commerce journey map, which typically focuses on a single buyer moving through a shorter, transaction-oriented path. The best template fits the customer segment being mapped, not the one with the most features.
Metrics that tell you whether your journey map is working
Experience and progression KPIs
Stage-to-stage conversion rates and drop-off rates at key friction points reveal whether the journey is actually moving customers forward. Customer Effort Score measures how easy the experience feels. Customer Satisfaction Score and Net Promoter Score capture how customers feel about specific touchpoints and the relationship overall. Time-to-convert shows whether the journey is getting faster as friction is removed.
These metrics function as leading indicators. They show whether experience improvements are making the journey smoother and more likely to result in a committed customer before the financial results fully materialize. Tracking them by stage rather than in aggregate reveals exactly where the gains are coming from.
Business outcome metrics
Customer lifetime value, churn rate, retention rate, average order or contract value, and cost per conversion are the metrics that connect journey improvements to financial outcomes. Industry data from journey mapping practitioners and CX research firms indicates that companies formally mapping the customer journey report substantially higher retention rates than those that do not, with some comparisons showing retention rates more than twice as high. Conversion rate improvements in the 20 to 50 percent range have been reported across documented implementations, though results vary by industry, baseline, and execution quality.
The goal of customer journey mapping is not a cleaner diagram; it's lower customer acquisition cost, higher lifetime value, and marketing spend that traces directly to revenue. A full-funnel acquisition strategy without this measurement layer is still guesswork with a better-looking slide deck.
The map is the foundation, not the finish line
Understanding what a customer journey map is and actually building one are two different commitments. The map is the foundational document that turns marketing from a series of channel-specific bets into a coherent system aligned to how customers actually behave. For mid-market brands trying to stretch budget further and prove marketing ROI, it is not an optional strategic exercise. It is the starting point. Everything built on top of it (campaign architecture, CRM design, retention programs, attribution modeling) is more accurate and more effective because the map revealed what is actually happening at the customer level.
This is the approach at the core of every new fractional CMO and marketing turnaround engagement at Ryan Paxton | Senior Marketing Executive: map the real customer journey first, identify where the system is leaking, and then rebuild spend and programs around what the evidence actually shows. The map does not just improve strategy. It changes the conversations leadership is willing to have and gives every team a shared, honest picture of what customers experience versus what the brand believes they experience.
If you are building your first journey map, inheriting a marketing program with unclear attribution, or trying to reconnect spend to real customer behavior, contact Ryan Paxton | Senior Marketing Executive to scope a fractional CMO engagement or full-funnel marketing audit for your organization.
Contact me today for more information and a discussion around your Customer Journey Process!
FAQ and Summary
What is a customer journey map?
A customer journey map is a visual representation of the complete experience a customer has with a brand, from first awareness through purchase and into post-purchase moments like onboarding, support, and loyalty. It documents customer actions, thoughts, emotional states, touchpoints, and pain points across time, based on what customers actually do rather than what the brand assumes they do.
How is a customer journey map different from a user journey map?
A user journey map, sometimes called a user flow, shows how someone navigates a specific task inside a product or interface. A customer journey map is broader: it covers the full brand experience across awareness, consideration, purchase, and retention, not just one in-product task.
What are the core stages of a customer journey map?
The core stages are awareness, consideration, purchase, onboarding, and retention and advocacy. Awareness is the first encounter with the brand; consideration is evaluation and comparison; purchase is a sequence of micro-decisions rather than a single click; onboarding shapes whether a customer stays or churns; and retention determines lifetime value and referral behavior.
How do you build a customer journey map?
Start with research, not an internal workshop: define a clear objective and customer segment, then gather evidence from customer interviews, support call themes, CRM records, session recordings, and conversion analytics. Map customer actions, emotions, touchpoints, and pain points stage by stage, then turn the findings into a prioritized action plan with assigned ownership and a review cadence.
What metrics show whether a journey map is working?
Experience metrics — stage-to-stage conversion rates, drop-off rates, Customer Effort Score, CSAT, NPS, and time-to-convert — act as leading indicators of a smoother journey. Business outcome metrics — customer lifetime value, churn rate, retention rate, average order value, and cost per conversion — show whether those experience improvements are translating into revenue.


Why Canongate Advisers
Frequently Asked Questions
Clear answers to help you make confident business decisions.
FAQ 1
Tempus leo eu aenean sed diam urna tempor. Pulvinar vivamus fringilla lacus nec metus bibendum egestas. Iaculis massa nisl malesuada lacinia integer nunc posuere.
FAQ 2
Tempus leo eu aenean sed diam urna tempor. Pulvinar vivamus fringilla lacus nec metus bibendum egestas. Iaculis massa nisl malesuada lacinia integer nunc posuere.
FAQ 3
Tempus leo eu aenean sed diam urna tempor. Pulvinar vivamus fringilla lacus nec metus bibendum egestas. Iaculis massa nisl malesuada lacinia integer nunc posuere.
FAQ 4
Tempus leo eu aenean sed diam urna tempor. Pulvinar vivamus fringilla lacus nec metus bibendum egestas. Iaculis massa nisl malesuada lacinia integer nunc posuere.

Get Started
Want to work with us?
Lorem ipsum dolor sit amet consectetur
adipiscing elit.
COMPANY
LEGAL
SOCIALS
Copyright 2026. mktgnj. All Rights Reserved.